Bounding Box Filtered Grafana Panels (with Postgis)
in Tech
Today at work I had to create some dynamic panels in Grafana for a project involving some geometry data in Postgresql (Postgis). Most of the data are polygons, with some meta data related to them.
Since we already use Mapserver with Postgresql for managing layers, it would be very natural to use the bounding box filtering, just like in WMS layers. This allow us to display statistics for some specific region of interest.
This feature, along with embed panels (via iframe) would totally solve the problem. However, how to achieve such feature in Grafana?
Creating a panel
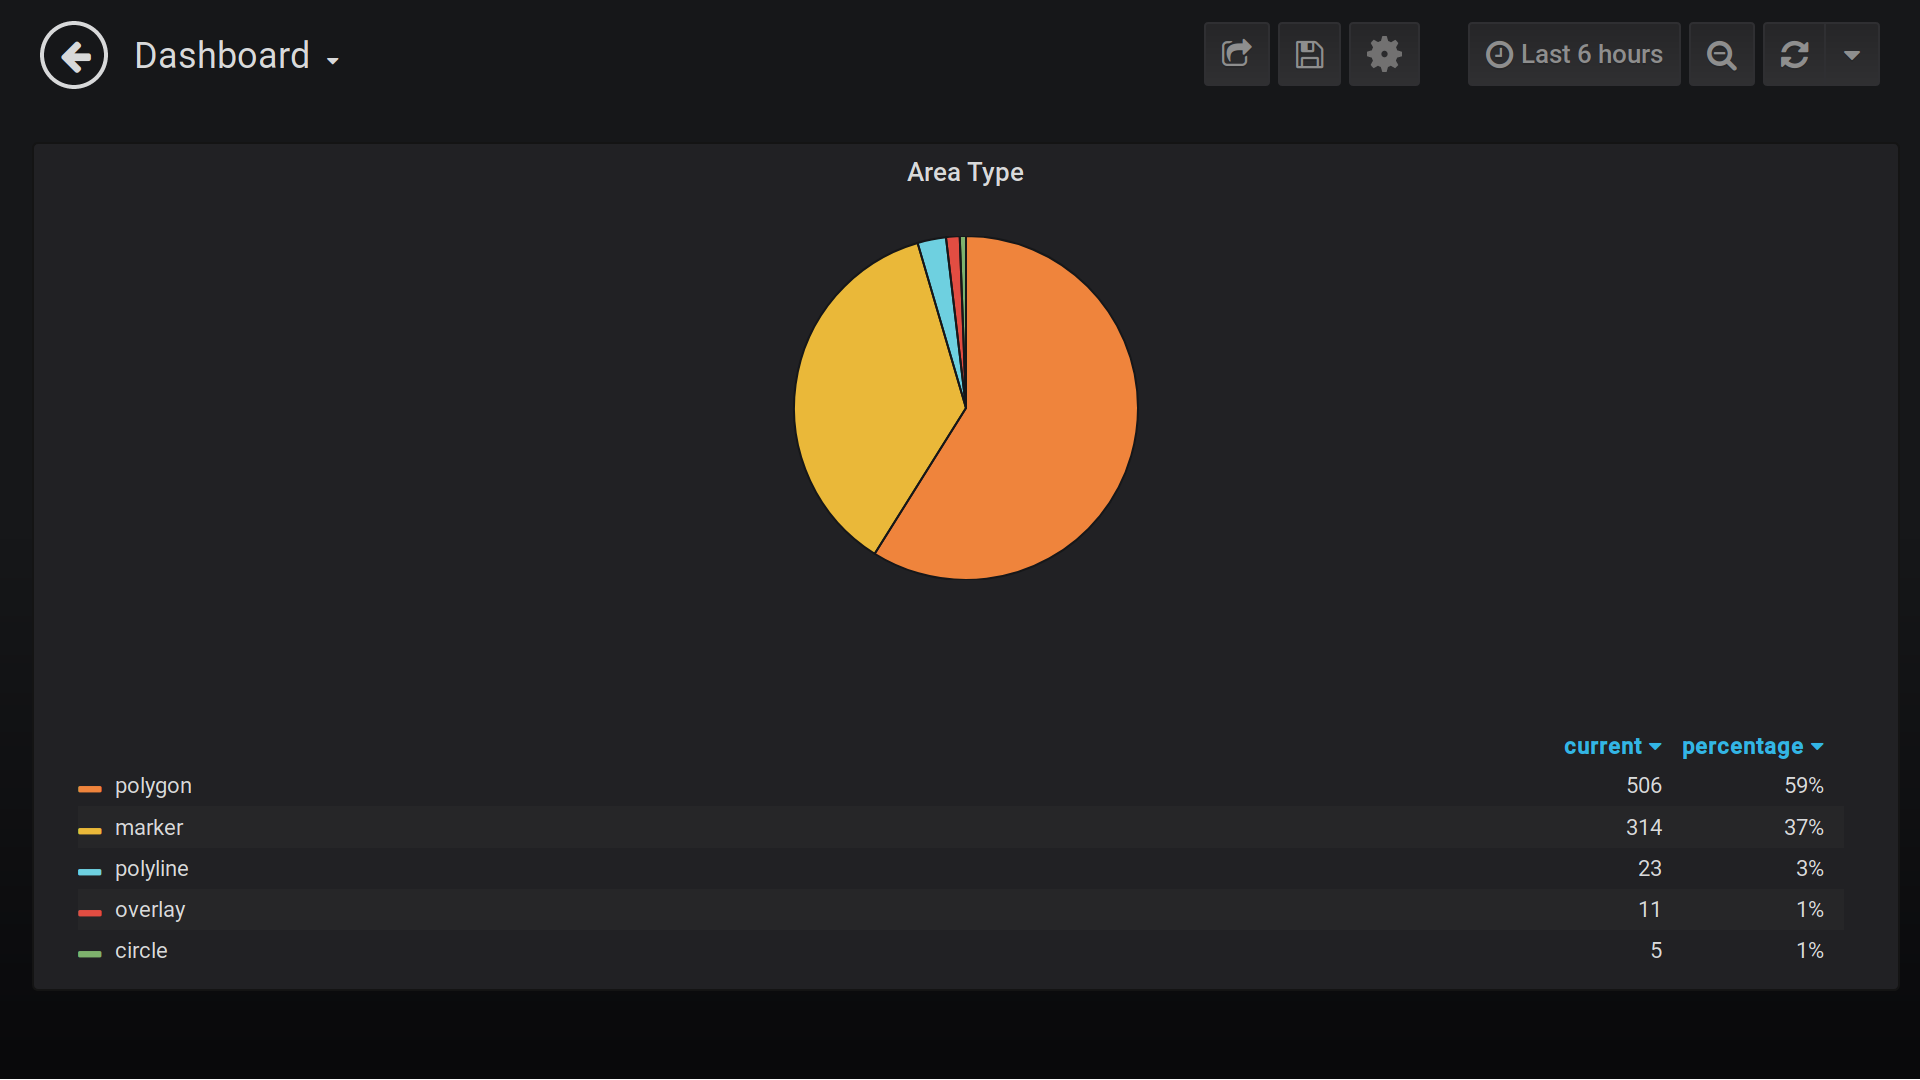
The following example creates a Pie Chart with some statistics about the geometry field (the type of the geometry, in this case)
Unfortunately, Grafana doesn’t support this kind for geometry filtering using a bbox.
But wait, what is bbox filtering?
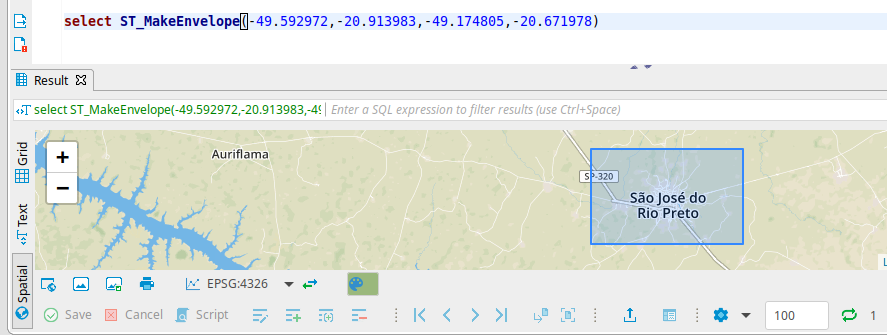
The following SQL example gives an overview on how to filter geometries using a bbox. You can find the right parameter for you here.
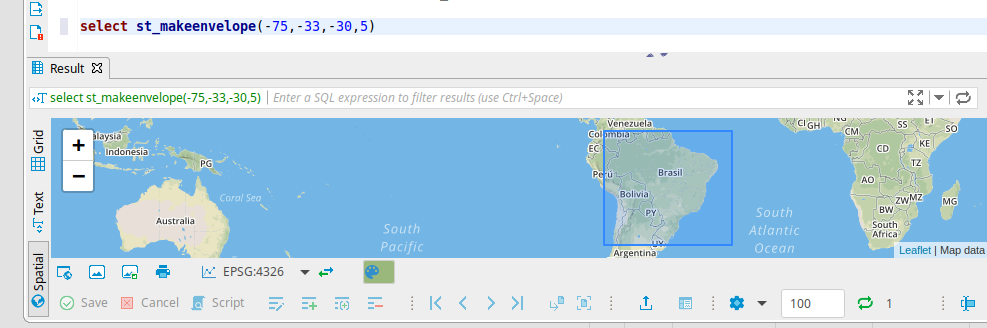
Once I have a polygon with an area of interest, I can add a where closure to only show geometries which are inside this bounding box
Now suppose we want to get some stats from a smaller region. Something like this:
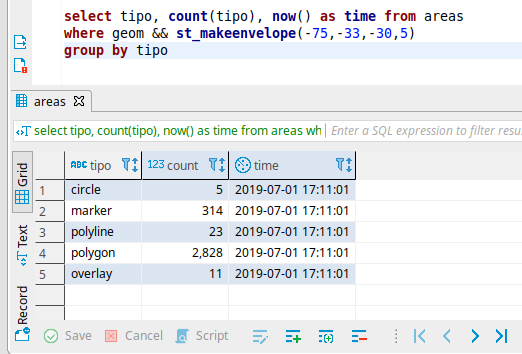
We just need to change the bbox value in the where closure:
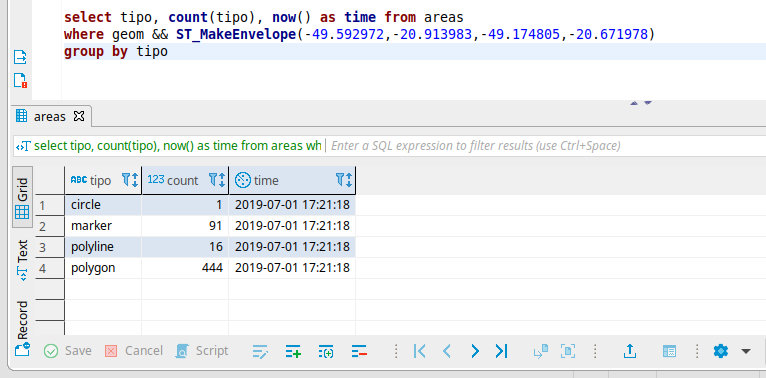
This way, only the geometries inside the polygon will be computed.
This is what a Mapserver does when a client requests a layer and inform the currently visible area of the map component.
The client usually send the bounding box in a query parameter like this:
https://somesite.com/wms?layers=somelayer&REQUEST=GetMap&BBOX=-52.185059,-24.447150,-43.912354,-19.269665
How to achieve this feature in Grafana?
Dashboard Variables
These dashboard variables provide a very efficient way to filter panels using predefined values. A variable is presented as a dropdown select box at the top of the dashboard. It has a current value and a set of options. The options are the set of values you can choose from.
You can get the options by some means:
- From a query to the database;
- A predefined interval of values;
- A list of datasources;
- Some hardcoded values.
These kinds of variables are very useful for most of the cases. However, a bounding box is not something we can get using a query and selecting from a dropdown list.
There is a way to override a variable value, no matter how the variable is defined in the first place.
We just need to pass the variable in the query string to the dashboard URL using the following sintax:
&var-somevar=somevalue
Defining a Dashboard Variable
Lets create a variable, so we can override it later.
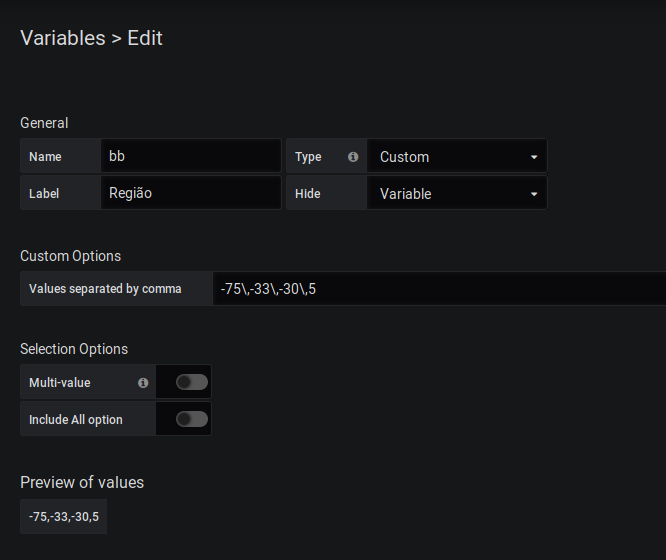
I created a single value list, with the bbox of the Brazil. This will be our default value used if no other value is passed.
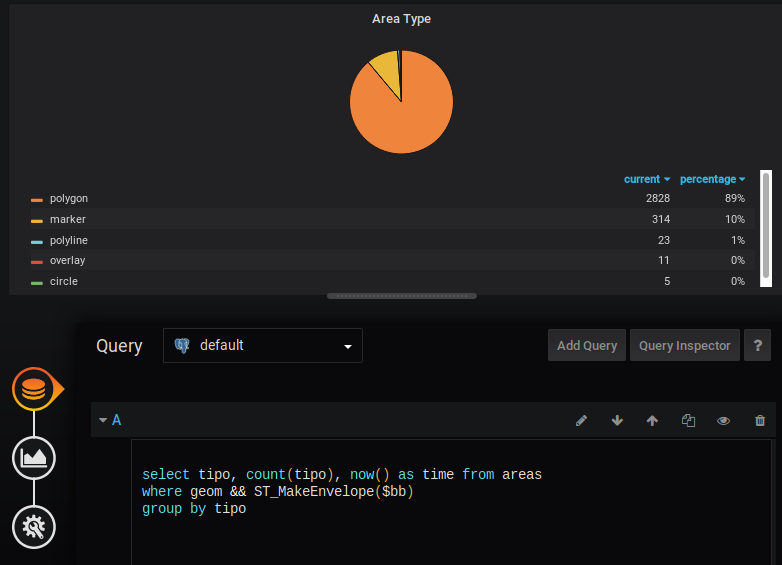
Now lets tweak our query to include the defined variable:
Sending the bbox to the panel
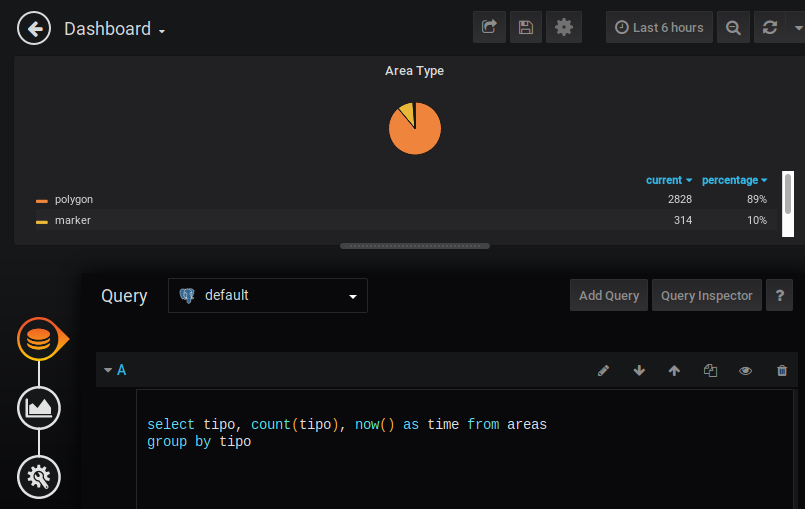
Once we get our panel with a default value working:
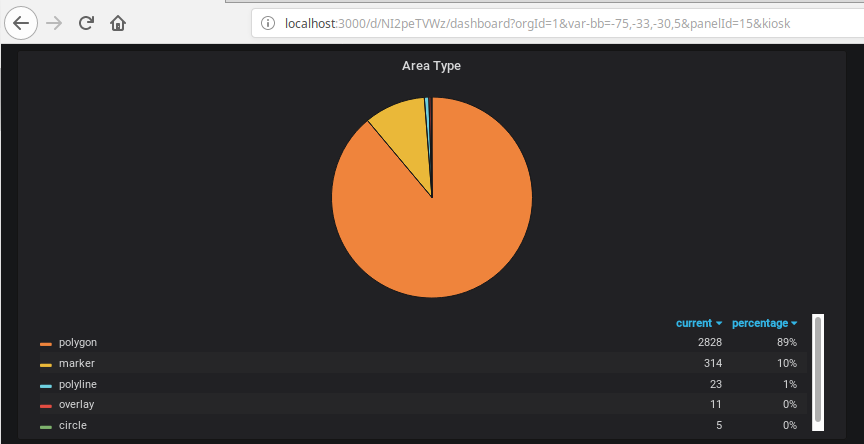
We can filter our panel to a smaller bbox by overriding the var-bb parameter:
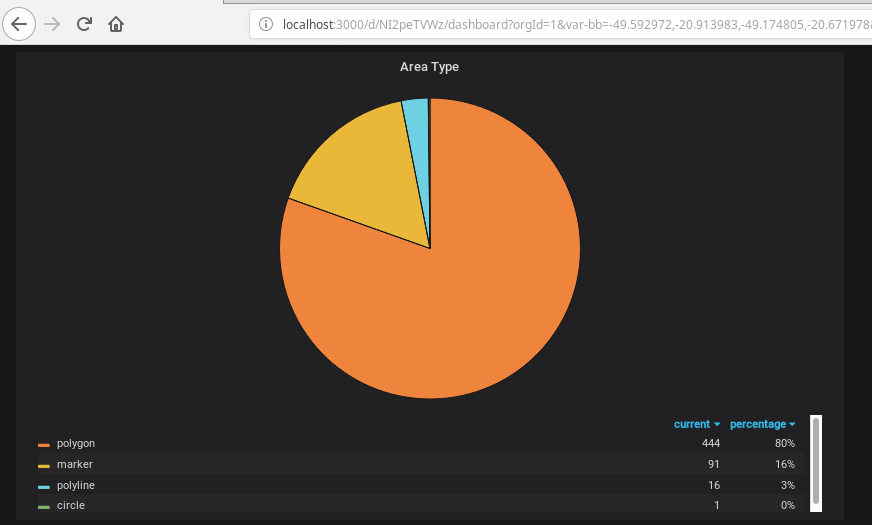
Notice that the query returned less values because of the smaller region provided in the url.
A big plus in this solution is that the bounding box parameter follow the same syntax in the Grafana panel and in a mapserver wms layer:
- Mapserver WMS layer request:
https://othersite.com/wms?layers=otherlayer&REQUEST=GetMap&BBOX=-49.592972,-20.913983,-49.174805,-20.671978
- Grafana Panel request:
http://grafanahost:3000/d/NI2peTVWz/dashboard?orgId=1&panelId=15&fullscreen&var-bb=-49.592972,-20.913983,-49.174805,-20.671978
We can easily integrate embed Grafana panels to an application with a map component. This way, in order to show statistics for particular regions, we can make use of the already present bbox parameter of the WMS layer.
Big Thanks to Lucija Raženj for helping me with dashboard variables in Grafana :)